Tutorials
Tutorial one, Study the function 0.5*x^3-x^2-3*x
First, we store the function in f[x].
![]()
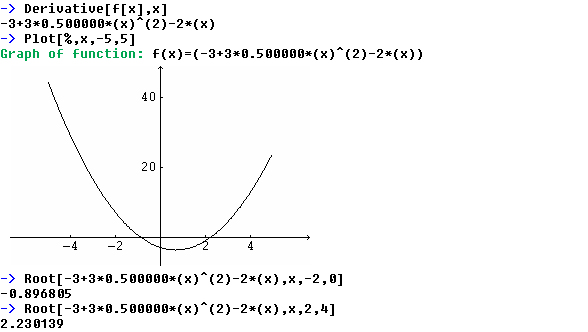
Second, we plot the function to se how it looks.
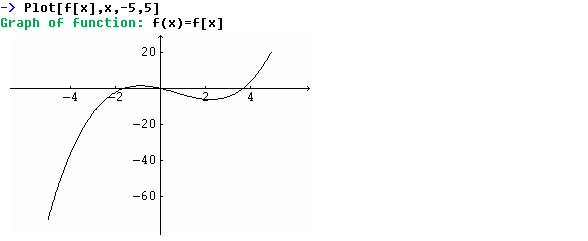
We see that it has three different zeros.
Third, we calculate the zeros.
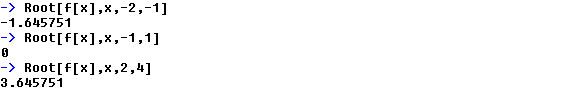
Fourth, find its derivative and look for critical points.
Tutorial two, Analyzes an image
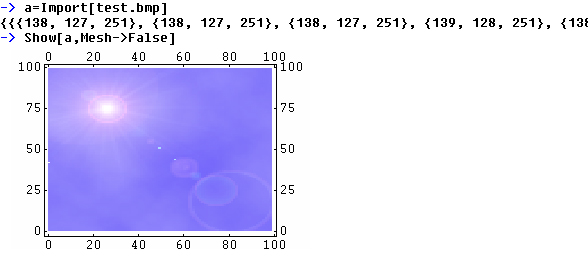
This load and the image "test.bmp", store it in the variable 'a' and
show it.
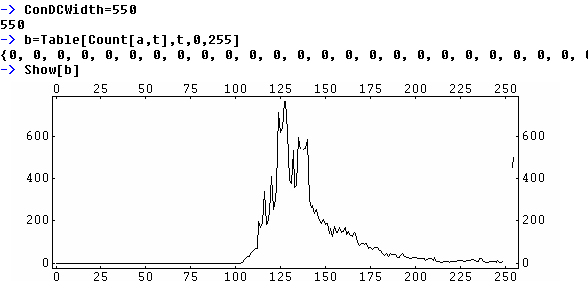
This make a table were each element of the table contain the number of
pixels with a specific color in the image. The result is a plot over color
distribution in the image. We set ConDCWidth to 550 to make the plot larger.
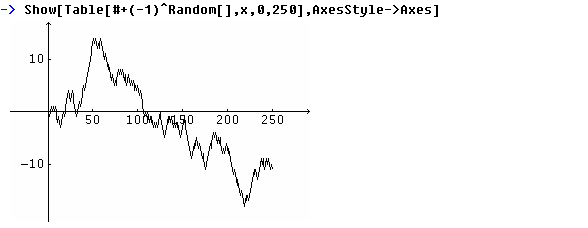
Tutorial three, make a "Random Walk"
A random walk is a plot where the y value can either go up or down for
each x value. If the y value goes up or down depends on the function Random[].
This makes a random walk with 250 steps.
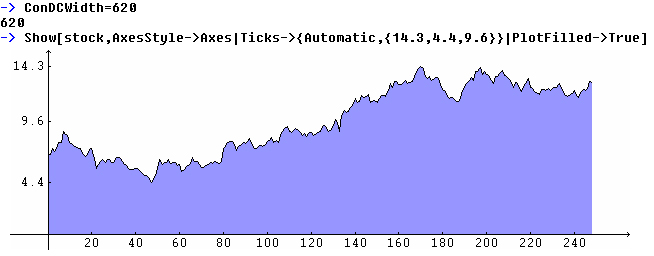
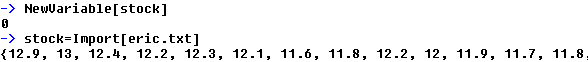
Tutorial four, study the history of Ericsson's stock price during 2003
First we load a ".txt" file with the closing price in Swedish kronor
for Ericsson every day the year 2003.
If we plot this data directly we will get the last price to the far left.
However, the normal way to plot a history of stock price is the opposite.
So we will flip the data.
![]()
We use 248 because there are 248 values in the file.
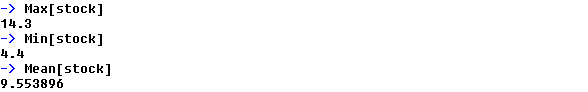
This calculates the max, min and mean of the data.
This makes a nice plot of the Ericsson's stock price during 2003.