Basic plotting
Here is a list of all functions that is associated with graphic.
| Plot | Plots simple y=f(x) functions |
| PlotParametric | Plots parametric functions, x=f(t) and y=g(t) |
| Plot3D | Plots a 3D surface where the height is defined by two variables, z=f(x, y) |
| PlotParametric3D | Plots a 3D parametric surface, x=f(u,w), y=g(u,w) and z=h(u,w) |
| PlotDensity | Plots a density image where the color is defined by two variables, z=f(x,y) |
| Show | Shows data |
Plot
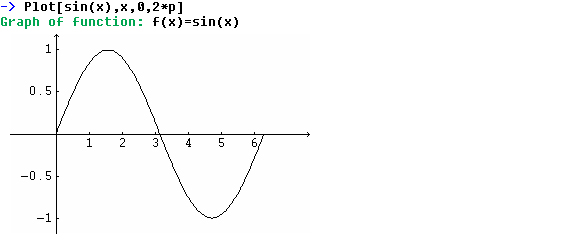
| Syntax: Plot[{f0,f1, }, x, xstart, xstop, Options] |
This plots a Sin function from zero to 2*Pi.
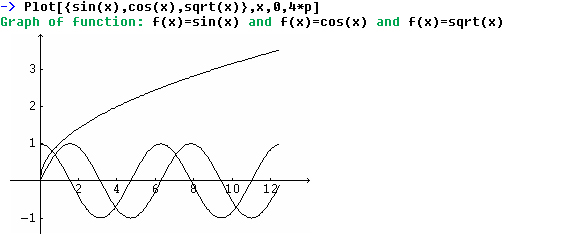
This plots three different functions in the same plot.
PlotParametric
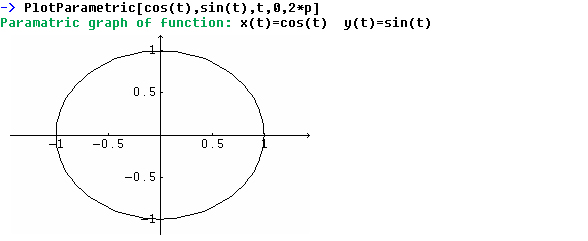
| Syntax: PlotParametric[{x0 ,x1,...}, {y0,y1,...}, t, tstart, tstop, Options] |
This plots a circle as a parametric plot, which means that the x value
is calculated from cos(t) and the y values from sin(t) where t goes from
zero to 2*Pi
Plot3D
| Syntax: Plot3D[{f0,f1,...}, x, xstart, xstop, y, ystart, ystop, step] |
Plot3D plots a surface where the height of the surface is a function of two variables, z=f(x, y).
This plots the function z=sin(x*y)
-025.jpg)
To choose a different angle hold down the mouse button over the plot and drag the mouse slowly in some direction. Depending on your computers speed it may take some time to update the plot.
PlotDensity
| Syntax: PlotDensity[{f0,f1,...}, x, xstart, xstop, y, ystart, ystop, Options] |
PlotDensity is used to plot functions that have two variables as Plot3D.
The function is a surface where the height is shown as a color. It is
very similar to Plot3D, in fact the only big difference is that the height
in Plot3D is represented by a color in PlotDensity.
This plots the function z=x+y
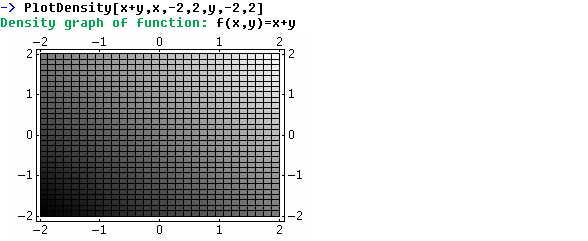
The grayscale represents the z value. Where black is the lowest value (-2+(-2)=-4) and white is the highest (2+2=4)
This plots the function z=sin(x*y) (the same function as in Plot3D)
.jpg)